Issue #3 – December 7, 2025
📍 Bottom Line Up Front
Saline Township’s $7 billion data center debate intensified this week. Attorney General Dana Nessel’s intervention successfully delayed the Michigan Public Service Commission’s decision on DTE Energy’s $500+ million infrastructure plan. The MPSC held its December 5th meeting but issued no ruling – leaving the approval in limbo as the December 18th township rezoning hearing approaches.
But the delay doesn’t address the fundamental question: Why is Michigan subsidizing corporations instead of building infrastructure that benefits everyone?
Less than 200 miles from Saline, Holland, Michigan has been capturing power plant waste heat for 35 years to melt downtown streets. Finland scaled that exact model to heat entire cities while data centers earn revenue from their waste heat.
Michigan could save $50+ billion over 20 years by redirecting subsidies to infrastructure. We have the proof. We have the blueprint. We’re just choosing not to build it.
🔥 What Happened December 5th
The MPSC Non-Decision
Michigan Public Service Commission held its scheduled meeting but issued no ruling on DTE’s plan:
What was at stake:
- $500+ million in ratepayer-subsidized infrastructure
- Fast-tracked approval process (expedited timeline)
- Contracts with “blacked out paragraphs and sections” (Nessel’s transparency objection)
- No public benefit requirement for waste heat utilization
Attorney General Dana Nessel’s Response (December 5):
Nessel called the MPSC’s delay “the right decision” and emphasized the need for thorough review:
“This is a decision that will affect Michigan ratepayers for decades. The Commission needs time to fully evaluate whether DTE customers are adequately protected if this massive project fails, and whether the contracts contain sufficient safeguards.”
Key Concerns Remain Unresolved:
- Who pays if the $7 billion project fails? ($500M+ ratepayer investment at risk)
- What’s in the “blacked out” contract sections? (Public subsidy, private secrecy)
- Why no waste heat recovery requirement? (1,400 MW could heat 46,000 homes)
- How does this set precedent? (DTE plans “6 gigawatts of additional projects”)
What’s Next:
- MPSC will issue decision at future date (timeline unclear)
- December 18, 2025: Saline Township rezoning hearing (possible final local decision point)
- Township can still reject despite MPSC approval (if/when it comes)
- Community opposition organizing for December 18 hearing
The Window Is Still Open:
The MPSC delay means there’s time to demand Finland standards before approval. Every day without a decision is another day to build the case for waste heat recovery, brownfield-first development, and public benefit requirements.
But December 18 remains critical. If the township approves rezoning, the project moves forward regardless of MPSC timeline.
🌨️ The System Nobody Talks About: Holland, Michigan
35 Years of Waste Heat Infrastructure
Distance from Saline: ~200 miles
What it is:
- North America’s largest municipally-owned snowmelt system
- Operating since 1988 (35 years continuous operation)
- 190 miles of underground piping circulating 4,700 gallons/minute at 95°F
- Heats 8 miles of streets and sidewalks (24 acres total surface area)
- Source: Waste heat from Holland Energy Park (power plant)
Performance:
- Melts 1 inch of snow per hour
- Works even at 20°F with 10mph winds
- Zero plowing, zero salt needed
- Roads last 30-40% longer (no salt corrosion)
- Designed to operate until 2089 (100-year infrastructure)
Economics:
- Initial cost: $1.1M (1988) = ~$2.8M in today’s dollars
- Funding: Ed Prince donated $250K, city $850K, businesses pay 52¢/sq ft annual assessment
- Current capacity: Can expand 4x beyond current size
Community Impact:
- Year-round downtown tourism (same winter activity as summer)
- Business district accessible in all weather
- Elderly and disabled can navigate safely
- No slip-and-fall liability for businesses
- Environmental: Zero road salt pollution
What Holland Proves:
- Waste heat infrastructure works in Michigan climate
- Community benefits justify investment
- Technology is 35 years mature (not experimental)
- Businesses willingly pay assessments (value received)
- System pays for itself over decades
The Question Nobody’s Asking:
If Holland captured power plant waste heat in 1988 to melt 8 miles of streets, why is there NO plan to capture data center waste heat in 2025 to heat 46,000 homes?
Finland: What Holland Started, They Perfected
The Scaled Success Model
Mäntsälä, Finland – Operating Since 2014:
Facility: 75 MW data center (Nebius/Yandex)
Community Benefit:
- Heats 2,500 homes (66% of town’s heating needs)
- Displaced natural gas heating (fossil fuel reduction)
- Energy costs stabilized for residents (insulated from gas price volatility)
- Data center EARNS revenue from selling waste heat (business model alignment)
Timeline: 10+ years proven operation (not theoretical)
Microsoft Espoo – Under Construction:
Facility: 150 MW data center campus (world’s largest heat recovery project)
Scale:
- Will heat 100,000 homes (40% of Finland’s 2nd-largest city)
- Target: Eliminate carbon emissions from city heating by 2030
- Jobs: 240 permanent positions (1.6 jobs per MW)
Infrastructure:
- Integrated with Fortum district heating network (existing municipal system)
- Multi-year planning coordination (government + utility + Microsoft)
- Long-term contracts (mutual benefit locks in both sides)
The Nordic Pattern
Sweden (Stockholm Data Parks):
- “No heat wasted” goal
- Multiple data centers integrated with city heating
- Municipal utility coordination
Denmark (Copenhagen):
- Hosts 30 data centers
- 80% renewable electricity grid
- District heating integration standard practice
Norway:
- 1+ gigawatt data center capacity
- Green Mountain (leader in sustainable operations)
- Hydropower + waste heat recovery
Common Elements Across All Nordic Data Centers:
- District heating infrastructure built FIRST (decades of investment)
- Data centers earn revenue from waste heat (not just cost avoidance)
- Public utility coordination (government role in planning)
- Long-term contracts (20-30 year agreements)
- Regulatory framework (waste heat utilization required)
Key Quote (DC Byte):
“The Nordic markets prove that sustainability and scalability can coexist when policy, power and planning move together.”
Why It Works
For Data Centers:
- Lower cooling costs (heat recovery reduces energy bills 30-40%)
- Revenue stream from waste heat sales (adds to bottom line)
- Sustainability credentials (ESG goals, corporate commitments)
- Regulatory compliance (EU mandates heat reuse)
- Long-term stability (mutual dependence with community)
For Communities:
- Residential heating costs drop 30-40% (vs. natural gas)
- Energy price stability (locked-in long-term contracts)
- Carbon reduction (displaces fossil fuel heating)
- Economic development (data centers stay long-term)
- Energy security (local heat source)
For Environment:
- Waste heat displaces natural gas (fossil fuel reduction)
- Efficiency gains (same energy serves dual purpose)
- Carbon goals achievable (cities on path to net-zero heating)
The Model:
Data centers don’t just “give away” waste heat. They EARN money from it. That creates economic incentive to stay (revenue stream), reduces cooling costs (operational savings), and aligns corporate interest with community benefit. Build a revenue model that returns the initial outlay to the state, then the companies generate pure profit from their waste.
It’s not charity. It’s business.
🌉 The Bridge: Why Upper Midwest = Perfect Location
What Finland Has, Michigan Also Has
1. Cold Climate (Competitive Advantage):
Finland: 6-month winters, temperatures -20°C to +20°C
Michigan: 6-month winters, temperatures -10°F to +40°F
Why It Matters:
- Cold outside air = free cooling (30-40% energy cost savings vs. warm climates)
- Year-round heating demand = waste heat always needed (not seasonal)
- Cold air more efficient for cooling (thermodynamics favor cold climates)
Virginia/North Carolina (current U.S. hubs): Hot, humid summers require massive cooling (higher energy costs, less efficient)
Texas/Arizona (growing hubs): Extreme heat stress on systems, water scarcity for cooling
Upper Midwest wins on climate efficiency.
2. Abundant Water (Great Lakes):
Resource: 21% of world’s surface fresh water (84% of North America’s)
Advantage:
- Data centers need water for cooling (closed-loop systems)
- Drought-proof (unlike Texas, Arizona, California)
- Great Lakes Compact protects resource (can’t be exported)
- Strategic U.S. asset (water scarcity accelerating globally)
3. Waste Heat Utility (Year-Round Demand):
Finland: District heating meets 46% of heating demand (national infrastructure)
Michigan: Heating oil, natural gas dominate (opportunity to displace fossil fuels)
Heating Season: October through April (7 months)
Cooling Season: May through September (5 months)
Result: Waste heat has immediate use 12 months/year (heating in winter, supplemental in summer)
Southern states: Heating season minimal (waste heat utility limited to ~3 months)
4. Brownfield Infrastructure (Hidden Advantage):
Michigan’s Industrial Legacy:
- 450,000+ contaminated sites from automotive/manufacturing era
- Vacant factory buildings with heavy electrical infrastructure
- Existing steam tunnel networks in cities (Detroit, Lansing, Ann Arbor)
- Rail access, heavy load roads, skilled trades workforce
Example – Switch PYRAMID (Grand Rapids):
- Former furniture factory brownfield
- 180,000 sq ft data center
- Contaminated site fully remediated
- Zero farmland destroyed
- Operating successfully
Finland builds on greenfield. Michigan has thousands of shovel-ready brownfields.
5. Displaced Workforce (Skills Transfer):
Automotive/Manufacturing Workers:
- HVAC systems (data center cooling = familiar)
- Electrical systems (power distribution, backup systems)
- Mechanical maintenance (pumps, chillers, generators)
- Industrial controls (automation, monitoring)
- Shift work culture (24/7 operations standard)
Educational Infrastructure:
- Community colleges with technical programs
- Apprenticeship traditions (skilled trades)
- Retraining capacity (automotive transitions)
Unlike Virginia (tech hub, different workforce) or Texas (oil/gas different skills), Michigan has EXACTLY the workforce data centers need.
Geographic Advantage: Upper Midwest Hub Potential
Central U.S. Location:
- Chicago (224 existing data centers, largest U.S. concentration)
- Detroit, Milwaukee, Minneapolis, Cleveland, Indianapolis within 500 miles
- Lower latency to both coasts than Virginia (geographic center)
Regional Characteristics:
- Wisconsin, Illinois, Indiana, Ohio, Michigan (5-state region)
- Cold climate (all 6+ month winters)
- Great Lakes water access (all states border lakes)
- Manufacturing workforce (all states have displaced auto/industrial workers)
- Brownfield sites (all states have industrial legacy contamination)
Current State:
- Illinois: 224 data centers (most in region)
- Michigan: 17 active proposals (catching up)
- Wisconsin: Multiple projects (Meta $1B Beaver Dam, Microsoft Mount Pleasant)
- Ohio: 185 data centers (established market)
- Indiana: Northern region proposals (near Michigan border)
Opportunity: Coordinate as REGIONAL hub (like Nordic countries cooperate) vs. compete internally
What’s Missing: Only Two Things
1. District Heating Infrastructure
Finland has it: Decades of public investment (post-WWII reconstruction, 1970s oil crisis response)
Michigan doesn’t… yet.
But Holland proves: It’s buildable, it works, businesses pay for it
The gap: Political will to invest in public infrastructure vs. subsidize private corporations
2. Policy Requiring Community Benefit
Finland/EU has:
- EU “Fit for 55” package: Data centers >100 kW must assess waste heat reuse
- Germany: 10% heat reuse by 2026, 20% by 2028 (mandatory)
- Finland: Municipal utilities negotiate heat recovery as standard practice
Michigan has:
- Tax incentives (HB 4906: through 2065 for brownfields, through 2050 for greenfield)
- No waste heat requirements
- No community benefit standards
- No public utility accountability for private profit
The gap: Regulatory framework connecting corporate subsidy to public benefit
The Brutal Honesty
Michigan has BETTER fundamentals than Finland:
- Colder winters (more free cooling, more heating demand)
- More water (Great Lakes vs. Baltic Sea)
- More brownfields (450K sites vs. Finland’s limited industrial legacy)
- Larger workforce (10M people vs. Finland’s 5.5M)
- Larger regional market (5-state Upper Midwest = 50M people)
What Finland has that Michigan lacks:
- Political will to build public infrastructure
- Policy requiring corporations to share benefits
- Decades of district heating investment
Michigan doesn’t need to copy Finland. Michigan needs to BUILD what Finland built 40 years ago.
We have Holland as proof it works. We have Finland as proof it scales. We have the climate, water, brownfields, and workforce.
We’re just choosing subsidies over infrastructure.
🔬 THE RESEARCH GAP: Why Nobody Connected These Dots Until Now
The Academic Work Exists – But It’s Trapped in Silos
European researchers have been studying data center waste heat economics for over a decade:
Aalto University (Finland) – 2018:
- Economic investment analysis of waste heat utilization
- Finding: Medium/large data centers show positive NPV
- Conclusion: “Economically viable for district heating”
ASME Journal of Engineering – 2025:
- Investment analysis across multiple data center sizes
- Finding: 0.65 to 3 year payback periods
- Case study: Beijing data centers could heat 3.5 million sq meters
Multiple European Ph.D. Dissertations (2018-2025):
- Technical feasibility studies
- Energy efficiency modeling
- Environmental impact assessments
- Economic optimization frameworks
Rice University Research Group:
- Combining waste heat + solar collectors
- Finding: 60-80% increase in energy output
- Quote: “The answer is yes, and it’s economically compelling”
The Research Is Comprehensive. So Why Isn’t Anyone Building This in the U.S.?
The Problem: Disciplinary Silos
Energy Researchers study waste heat recovery (technical feasibility, environmental benefits)
Urban Planners study district heating systems (infrastructure design, network planning)
Economists study ROI models (investment analysis, cost-benefit calculations)
Policy Analysts study subsidy effectiveness (tax incentives, economic development)
Transportation Engineers study winter road maintenance (salt costs, accident rates)
Public Health Researchers study accident economics (injury costs, healthcare burden)
Each group produces excellent work IN THEIR FIELD.
Nobody synthesizes:
“Michigan should redirect $3B in data center subsidies to build district heating infrastructure because it would save $50B over 20 years in road maintenance ($2B) + accident reduction ($5.2B) + resident utility bills ($4B) + productivity gains ($18B) + economic development ($20B) while making data centers WANT to locate here because they’d earn revenue from waste heat just like Finland’s model that’s been working for 10+ years.”
That sentence requires expertise from:
- Energy engineering (waste heat capture)
- Urban infrastructure (district heating networks)
- Economics (ROI calculations)
- Transportation (road maintenance costs)
- Public health (accident cost analysis)
- Public policy (subsidy redirection)
- International comparative analysis (Finland model)
- Local knowledge (Holland’s 35-year example)
Academic research doesn’t work that way. You publish in YOUR discipline’s journal. You don’t synthesize across eight fields and translate it into state legislative action.
The European vs. U.S. Context Gap
European research ASSUMES:
- District heating infrastructure already exists (built over decades)
- Public utilities coordinate with operators (government role)
- Regulatory mandates drive adoption (EU “Fit for 55” package)
U.S. policymakers READ:
- “Works in Finland where infrastructure exists”
- “European utilities coordinate effectively”
- “Germany mandates 20% heat reuse by 2028”
U.S. policymakers CONCLUDE:
- “We don’t have that infrastructure, so it won’t work here”
- “Our utilities are private, not coordinated”
- “We don’t have regulatory mandates”
The MISSING conclusion nobody’s making:
“BUILD THE INFRASTRUCTURE FIRST (using the subsidy money we’re already spending), THEN data centers will want to locate here (because they earn revenue from waste heat), exactly like Finland did.”
It’s not “copy Finland’s model” – it’s “BUILD what Finland built.”
European researchers study how to USE existing infrastructure.
U.S. needs someone to say: “Here’s why and how to BUILD the infrastructure.”
Nobody’s doing that translation.
Who Should Be Connecting These Dots (But Isn’t That We Could Find)
Michigan Think Tanks:
- Michigan Future Inc. – Urban policy, talent attraction (not infrastructure economics)
- Citizens Research Council of Michigan – Fiscal policy (not cross-disciplinary synthesis)
- Anderson Economic Group – Economic analysis (corporate-focused, not worker/community)
- Detroit Regional Chamber – Economic development (status quo subsidies, not infrastructure vision)
National Policy Organizations:
- Brookings Metro – Cities/infrastructure (not connecting to data center subsidies)
- Rocky Mountain Institute – Energy transition (not state-level policy frameworks)
- Urban Institute – Housing/community development (missing the data center angle)
Universities:
- U of M Energy Institute – Has the technical expertise (not doing state policy advocacy)
- MSU Urban Planning – Has the infrastructure knowledge (not synthesizing economics)
- Wayne State Economics – Has the economic modeling (not connecting to energy policy)
Why The Gap Exists:
1. Academic Incentive Structure:
- Publish in YOUR discipline’s journal (narrow focus)
- Don’t synthesize across fields (not rewarded)
- Don’t translate research to policy (not your role)
- Timeline: 2-3 years per paper (too slow for active legislation)
2. Think Tank Focus:
- Narrow mission statements (stay in your lane)
- Donor/funder restrictions (don’t ruffle corporate feathers)
- Risk aversion (don’t challenge status quo subsidies)
3. Corporate Capture:
- DTE Energy lobbies for subsidies (deep pockets, access to legislators)
- Data center developers want easy approvals (political connections)
- Nobody’s lobbying FOR district heating infrastructure (no organized constituency)
4. The Holland Blindness:
Most Damning: Michigan has a 35-year working example ~200 miles from Saline.
But:
- Holland doesn’t publish economic analysis of their system
- State policymakers don’t study it as infrastructure model
- Media covers it as “quirky local feature” not “blueprint for $50B in savings”
- Data center debate completely ignores it
It’s like having the solution in your basement while hiring consultants to solve the problem.
We synthesized eight research disciplines into one actionable framework:
1. Academic Research (Energy Engineering):
- Finland studies showing economic viability
- European Ph.D. dissertations on waste heat recovery
- ASME journal findings on ROI
2. Local Proof (Infrastructure):
- Holland’s 35-year snowmelt system
- 190 miles of piping, $2.8M investment
- Infrastructure designed until 2089
3. Economic Modeling (Finance):
- $50B total benefit over 20 years
- 25:1 to 33:1 return on investment
- Road maintenance + accidents + utilities + productivity
4. Worker Analysis (Labor Economics):
- Finland: 1.6 jobs per MW
- Saline: 0.05 jobs per MW
- 32x difference in job creation
5. Community Benefit (Public Policy):
- Resident utility savings: $4B over 20 years
- Snow-free streets: Holland model
- Brownfield remediation: 450,000 sites
6. Environmental Impact (Climate Policy):
- Great Lakes protection (closed-loop systems)
- Natural gas displacement (waste heat replaces fossil fuels)
- Brownfield cleanup (contaminated sites remediated)
7. Transportation Economics (Public Safety):
- Winter accident costs: $2.6B annually
- 10% reduction saves $260M/year
- Road maintenance savings: $100M/year
8. Political Framework (Legislative Strategy):
- Subsidy redirection (not new spending)
- Infrastructure-first approach (attract, don’t extract)
- Finland benchmark (proven international model)This is multi-disciplinary policy research.
Why This Matters for Michigan Right Now
December 18 Hearings aren’t just about Saline.
They’re about whether Michigan:
Option A: Continues Current Path
- Spend $3B+ on data center subsidies over 10 years
- Get zero public benefit
- Destroy farmland
- Continue spending $3.4B/year on winter maintenance + accidents
- Watch data centers leave when tax exemptions expire
Option B: Builds Infrastructure Instead
- Invest $500M-$1B in district heating networks (one-time)
- Data centers locate here BECAUSE infrastructure exists
- They EARN revenue from waste heat (incentive to stay)
- Save $50B+ over 20 years (ROI: 25:1 to 33:1)
- Create 2,000+ permanent jobs building + operating systems
- Heat homes, melt streets, clean brownfields
The research proving Option B works has existed in academic journals for a decade.
The working example proving it’s possible has existed in Holland, Michigan for 35 years.
Nobody connected them to Michigan’s current policy debate.
Until now.
💰 The $500 Million Question: Why Subsidize Instead of Build?
Current Michigan Approach
Tax Incentives (HB 4906 – Expires 2050 for greenfield, 2065 for brownfield):
- Data centers exempt from sales/use tax on equipment
- Personal property tax exemptions
- “Renaissance zones” with additional incentives
Direct Subsidies:
- Infrastructure upgrades paid by ratepayers (Saline: $500M+ from DTE customers)
- Utility rate discounts
- Fast-track permitting
Estimated Total: $3+ billion over 10 years across 17 active proposals
What $3 Billion Buys Under Current Model
Saline Alone ($500M ratepayer subsidy):
- 1,400 MW capacity
- 50-75 permanent jobs (0.05 jobs per MW)
- 25-year tax exemption
- Zero waste heat recovery
- Zero resident benefit
Farmland Conversion:
- 1,000 acres agricultural land destroyed
- Historic contamination from adjacent Pall industrial site
- Groundwater impacts unknown (assessments incomplete)
Precedent Set:
- DTE can fast-track future projects
- Ratepayers fund corporate infrastructure with no benefit requirement
- Community opposition legally neutered (Saline settlement after lawsuit threat)
Alternative: The Infrastructure Investment Model
Same $3 Billion Redirected to District Heating Networks:
Ann Arbor ($25M):
- Connect to Saline data center waste heat (1,400 MW capacity)
- Heat 46,000+ homes (calculations: 1 MW waste heat serves ~33 homes)
- Reduce residential heating costs 30-40%
- Eliminate need for future data center subsidies (they come because infrastructure exists)
Detroit ($200M):
- Existing steam tunnel infrastructure from automotive era
- Multiple potential data center sites (brownfields)
- Could heat downtown + midtown (100,000+ units)
- Connect to DTE plants + future data centers
Lansing ($40M):
- Expand Deep Green model (existing waste heat capture)
- Connect Michigan State University campus
- Integrate future data centers into network
Grand Rapids ($50M):
- Connect Switch PYRAMID data center (existing facility, no waste heat recovery currently)
- Expand to downtown heating
- Brownfield redevelopment catalyst
Flint ($50M):
- Water crisis remediation + heating infrastructure
- Environmental justice investment
- Brownfield cleanup tied to development
10+ Other Cities ($135M):
- Traverse City, Kalamazoo, Saginaw, Battle Creek, Midland, Bay City, Jackson, Muskegon, Pontiac, Port Huron
- Regional hub development
- Coordinate with local power generation + future data centers
Total: $500M builds comprehensive statewide network
Remaining $2.5B: Reserve for future expansion, maintenance, additional cities
Why This Changes Data Center Calculus
Current Model (Subsidize to Attract):
- Data center evaluates: Cheap land, tax breaks, fast permits
- Commitment: Until tax exemption expires (25 years)
- After exemption: Evaluate relocation (stranded assets for community)
Infrastructure Model (Attract by Existing Value):
- Data center evaluates: Cooling efficiency (30-40% energy savings), revenue from waste heat, sustainability credentials
- Commitment: Long-term (heat contracts 20-30 years, mutual dependence)
- After contract: Renew (both sides benefit from continuation)
Finland Proves This Works:
- Mäntsälä: 10+ years operation (didn’t require subsidy to stay)
- Microsoft Espoo: 20+ year planning horizon (locked in by heat contracts)
- No subsidies required – data centers WANT to be there
The Math
Current Path:
- Spend: $3B in subsidies over 10 years
- Get: ~500 permanent jobs across 17 projects (0.05 jobs per MW average)
- Cost per job: $6 million
- Public benefit: Zero (ratepayers fund, corporations benefit)
- Duration: Data centers leave when exemptions expire
Infrastructure Path:
- Spend: $500M-$1B infrastructure (one-time)
- Get: 2,000+ construction jobs (building networks), 500+ permanent operations jobs (running systems), data centers that WANT to locate here
- Cost per job: $400K (construction + operations combined)
- Public benefit: $50B+ over 20 years (detailed in next section)
- Duration: 100-year infrastructure (Holland’s system designed until 2089)
ROI: Every $1 invested returns $25-33 in economic benefits
📊 THE HIDDEN SAVINGS: Total Economic Impact Over 20 Years
The Comprehensive Calculation
Investment Required:
- District heating infrastructure: $500M-$1B (one-time build)
- 20-year maintenance: $1B (operational costs)
- TOTAL COST: $1.5B – $2B
Economic Benefits (20-Year Horizon)
1. Road Maintenance Savings: $2 Billion
Current Michigan Winter Costs (Annual):
- Road salt: $31.5M (buying + spreading)
- Snow plowing: $150-200M (equipment + labor)
- Accelerated repaving: $300M+ (salt corrosion damages roads 30-40% faster)
- Total: ~$500M annually
Holland Proof:
- Zero salt needed (waste heat melts snow)
- Zero plowing costs (snow melts as it falls)
- Roads last 30-40% longer (quote: “Infrastructure lasts longer, don’t have to repave like other places”)
Conservative Estimate:
- Top 10 Michigan cities build snowmelt networks (Ann Arbor, Detroit, Grand Rapids, Lansing, Flint, Kalamazoo, Saginaw, Dearborn, Sterling Heights, Warren)
- Covers 20% of state road maintenance burden
- Saves: $100M annually
- 20-year total: $2B
2. Accident & Healthcare Savings: $5.2 Billion
Michigan Winter Crash Statistics (Annual):
- ~55,000 crashes on snow/ice-covered roads
- ~15,000 injuries
- ~100 deaths
- Economic cost: $2.6 billion annually (MDOT + insurance industry data)
Breakdown:
- Direct healthcare costs: $500M (emergency, hospital, rehabilitation)
- Lost productivity: $1.2B (missed work, disability)
- Property damage: $600M (vehicles, infrastructure)
- Emergency response: $100M (police, fire, ambulance)
- Legal/insurance admin: $200M (claims processing, litigation)
Snowmelt Impact:
- Holland: “Can navigate safely year-round, elderly/disabled access maintained”
- Reduction in downtown crashes: Estimated 60-80% (dry pavement vs. snow/ice)
- Regional network covering business districts: Conservative 10% statewide crash reduction
Conservative Calculation:
- 10% reduction in winter crashes = 5,500 fewer crashes
- 10% reduction in injuries = 1,500 fewer injuries annually
- 10% reduction in deaths = 10 lives saved annually
- Economic savings: $260M annually
- 20-year total: $5.2B
Human Impact (Not Quantifiable in Dollars):
- 30,000+ injuries prevented
- 200 lives saved
- Families not destroyed by winter crashes
3. Resident Utility Savings: $4 Billion
Current Residential Heating Costs:
- Natural gas heating: $900-$1,500 per home annually (Michigan average)
- 500,000 homes in top 10 cities
Finland District Heating Model:
- Residential heating costs: 30-40% lower than natural gas
- Energy price stability (locked long-term contracts insulate from volatility)
- Mäntsälä example: 2,500 homes, 66% of heating needs met by data center waste heat
Conservative Michigan Calculation:
- 500,000 homes in networked cities
- Average current cost: $1,200/year
- Savings: 30% reduction = $400/home annually (conservative vs. Finland’s 40%)
- Annual savings: $200M
- 20-year total: $4B
Additional Benefits:
- Energy security (local heat source, not dependent on natural gas supply chain)
- Price stability (not subject to winter gas price spikes)
- Carbon reduction (displaces fossil fuel heating)
4. Eliminated Data Center Subsidies: $2.5 Billion
Current Model:
- Saline alone: $500M ratepayer subsidy + 25-year tax exemption
- 16 other active proposals: Estimated $300M average subsidy each
- Next 10 years: 8-10 projects approved
- Total subsidy cost: $3B+ over 10 years
Infrastructure Model:
- Build infrastructure FIRST: $500M-$1B
- Data centers locate WITHOUT subsidies (Finland model – they WANT to be where infrastructure exists)
- They PAY for waste heat connection (cost recovery, not subsidy)
- Long-term contracts (20-30 years, mutual benefit)
Net Savings:
- Eliminate future subsidies: $2.5B over 10 years
- 20-year total (assuming pattern continues): $5B
Conservative 20-year calculation: $2.5B (only counting first 10 years)
5. Productivity Gains: $18 Billion
Michigan Winter Work Disruptions:
- Severe weather closures: 5-10 days annually (schools, businesses, government)
- Partial disruptions: 20-30 days with delayed openings, early closures, reduced productivity
- Remote work not possible for: Manufacturing, retail, healthcare, construction, food service (60%+ of Michigan workforce)
Economic Impact of Disruptions:
- 1 million workers affected by winter closures
- Average daily productivity loss: $300 per worker (wages + business revenue)
- Conservative: 5 full work days lost annually due to severe weather
Current Annual Loss: $1.5B (1M workers × $300/day × 5 days)
Snowmelt Network Impact:
- Business districts remain accessible (Holland model: “same tourism in winter as summer”)
- Critical infrastructure roads cleared (hospitals, emergency services, schools)
- Reduction in weather closures: 50% in networked areas (3 days saved annually vs. non-networked)
Conservative Calculation:
- 1M workers in networked city business districts
- 3 productive days gained annually (vs. current weather closures)
- $300 per worker per day
- Annual gain: $900M
- 20-year total: $18B
6. Economic Development: $20 Billion
Holland’s Economic Impact:
- Quote: “Same tourism in winter as summer” (year-round economy)
- Business district fully accessible (weather-proof)
- Retail sales maintained in winter (tourists + residents shop regardless of weather)
- Event hosting: Winter festivals, conferences, activities (don’t cancel due to snow)
Statewide Winter Tourism:
- Current: $10B annually (skiing, snowmobiling, ice fishing)
- Gap: Urban winter tourism limited (snow/ice reduces city visits)
Snowmelt Network Creates:
- Year-round urban tourism (Holland model proves it)
- Winter conference hosting (Ann Arbor, Grand Rapids, Detroit become winter-viable)
- Extended business hours (retailers don’t close early due to weather)
- Downtown residential appeal (accessible in winter = higher property values)
Conservative Economic Development Estimate:
- 10% increase in winter urban economic activity
- Current winter urban economy: ~$10B (retail + dining + entertainment in cities during Nov-Mar)
- Growth: $1B annually
- 20-year total: $20B
Property Value Impact (Not Quantified Above):
- Holland: Homes near snowmelt system command premium
- Ann Arbor/Detroit/Grand Rapids: Downtown property values increase with year-round accessibility
- Conservative estimate: 5-10% property value increase in served areas
7. Environmental & Health Benefits: $1 Billion
Salt Pollution:
- Current: 400,000 tons annually spread on Michigan roads
- Groundwater contamination (wells becoming too salty for drinking)
- Great Lakes pollution (salt doesn’t disappear, accumulates)
- Vegetation damage ($50M+ annually in landscape/forest damage)
Snowmelt Eliminates Salt:
- Zero road salt and other contaminants in networked areas
- Reduced groundwater contamination
- Great Lakes protection
- Healthier urban ecosystems
Health Impacts:
- Reduced respiratory issues from road salt dust
- Fewer slip-and-fall injuries (dry pavement vs. ice)
- Reduced cardiovascular stress (shoveling snow = heart attack risk)
- Pet health (salt on paws, ingestion)
Conservative Valuation:
- Environmental remediation savings: $30M annually
- Health cost reductions: $20M annually
- Total: $50M annually
- 20-year total: $1B
TOTAL ECONOMIC BENEFITS: $52.7 Billion (20 Years)
Breakdown:
- Road maintenance savings: $2B
- Accident & healthcare savings: $5.2B
- Resident utility savings: $4B
- Eliminated subsidies: $2.5B
- Productivity gains: $18B
- Economic development: $20B
- Environmental/health: $1B
Investment Required: $1.5B – $2B
NET BENEFIT: $50+ Billion
Return on Investment: 25:1 to 33:1
Every $1 invested in district heating infrastructure returns $25-33 in total economic benefit over 20 years.
What This Means
This isn’t about stopping data centers.
This is about demanding Michigan capture value we’re currently throwing away.
Saline’s 1,400 MW facility would generate enough waste heat to:
- Heat 46,000 homes (eliminating $18M annually in residential heating costs)
- OR melt 50+ miles of streets (eliminating $15M annually in winter maintenance)
- OR both partially (hybrid model like Finland uses)
Current plan: Dump waste heat into atmosphere. Spend $500M to subsidize it. Get zero public benefit.
Alternative: Spend $25M connecting Ann Arbor to waste heat network. Save $50B+ statewide over 20 years.
The math is brutal: We’re choosing to waste $50 billion to protect $3 billion in corporate subsidies.
🏭 The Better Alternative: Brownfields First
Michigan’s Hidden Asset
450,000+ contaminated sites from automotive/manufacturing era
Current Status:
- Abandoned buildings (vacant factories, closed plants)
- Contaminated soil (industrial chemicals, heavy metals)
- Groundwater pollution (leaking into Great Lakes watershed)
- Economic burden (can’t develop, property values depressed)
- Public health risk (exposure to toxins)
Cost to Remediate:
- Full cleanup: $50K – $5M per site (depending on contamination level)
- Michigan doesn’t have budget for comprehensive cleanup
- Sites sit abandoned for decades (ongoing pollution)
Data Centers Need Clean Land Anyway
You Can’t Build on Contaminated Ground:
- Foundation integrity requires stable soil
- Electrical/cooling systems can’t risk contamination
- Water systems require clean supply
- Worker safety regulations require remediation
Current Developer Approach:
- Remediate only the building footprint (minimal cleanup)
- Leave surrounding site contaminated
- No groundwater treatment
- No ongoing monitoring
Example: Saline’s Hidden Problem
- Pall Life Sciences industrial site with documented contamination adjacent to proposed data center, sharing the same groundwater table
- Historic contamination documented
- Groundwater assessment incomplete
- Water table concerns (Great Lakes watershed)
Brownfield-First Policy Framework
HB 4906 Already Offers Better Incentives:
- Brownfield projects: Tax exemptions through 2065 (40 years)
- Greenfield projects: Tax exemptions through 2050 (25 years)
- 15-year advantage for brownfield development
Why Isn’t It Working?
- No enforcement (exemptions given to greenfield anyway)
- No prioritization (developers choose easy farmland)
- No remediation standards (cleanup minimized)
- No community benefit requirement (no waste heat mandates)
Proposed Policy Addition:
To Qualify for Tax Incentives, Data Center Projects Must:
1. Brownfield Priority:
- Demonstrate ALL suitable brownfield sites evaluated first
- Justify why greenfield necessary (if no brownfield works)
- Preference score: Brownfield = 100 points, Greenfield = 0 points
2. Comprehensive Remediation:
- Clean ENTIRE site, not just building pad
- Groundwater treatment and monitoring (20-year commitment)
- Soil remediation to residential standards (not just industrial)
- Third-party verification (not developer self-assessment)
3. Waste Heat Utilization Plan:
- Demonstrate technical feasibility of heat capture
- Connect to existing district heating OR commit to build network
- Revenue-sharing with municipality (heat sales benefit community)
- Performance standards (minimum % of waste heat recovered)
4. Great Lakes Protection:
- Closed-loop cooling systems (zero water discharge)
- Water usage transparency (monthly public reporting)
- Contamination prevention (no chemicals entering watershed)
- Monitoring wells (community access to data)
5. Public Transparency:
- Open contracts (no “blacked out paragraphs” like Saline)
- Community benefit agreements (negotiated BEFORE approval)
- Job commitments (actual positions, not PR numbers)
- Regular public reporting (energy use, water use, employment)
The Opportunity
If Next 10 Data Centers Built on Brownfields:
- 10 sites × average 200 acres = 2,000 acres remediated
- 10 sites × $2M average cleanup = $20M environmental investment (developer pays)
- Groundwater quality improves (drinking water protection)
- Vacant industrial land returns to productive use
- Zero farmland destroyed
Economic Development:
- Brownfield areas typically economically depressed
- Data centers create jobs where needed most (Flint, Detroit, Saginaw)
- Surrounding property values increase (cleaned site = development catalyst)
- Community benefits where damage occurred (automotive collapse areas)
The Switch PYRAMID Model (Grand Rapids)
What It Proves:
Before:
- Abandoned furniture factory
- Contaminated brownfield site
- Neighborhood eyesore
- Property tax burden (unproductive land)
After:
- 180,000 sq ft data center (Switch operates)
- Full site remediation completed
- 100+ permanent jobs
- Property tax revenue restored
- Zero farmland destroyed
Why It Works:
- Existing heavy electrical infrastructure (factory legacy)
- Transportation access (rail + highway)
- Urban location (workers don’t need cars)
- Remediation required anyway (developer cost, public benefit)
This Should Be The Template, Not The Exception.
💧 The Water Question: Closed-Loop vs. Discharge
Great Lakes: 21% of World’s Fresh Water
Resource Scale:
- 84% of North America’s surface fresh water
- 6 quadrillion gallons total
- Renewable (precipitation, rivers, groundwater recharge)
Strategic Asset:
- Texas facing severe drought (data centers compete with residents for water)
- Arizona groundwater depletion (Phoenix limits development)
- California water scarcity (permanent rationing)
- Great Lakes Compact protects resource (can’t export water)
Michigan’s Competitive Advantage: Drought-proofs data center development
Water System Realities: What “Closed-Loop” Actually Means
Initial Fill:
- Large one-time withdrawal (5-10 million gallons for 1,400 MW facility)
- Permitted through EGLE water withdrawal process
- Significant but one-time impact vs. continuous withdrawal
Ongoing Water Needs Vary by Cooling Method:
Once-Through Cooling (WORST):
- Continuous withdrawal: 15-30 million gallons DAILY
- Annual total: 5-10 BILLION gallons
- All water returned heated (thermal pollution)
- Direct Great Lakes impact
Closed-Loop Evaporative Cooling (BETTER):
- Daily makeup water: 50,000-200,000 gallons (replaces evaporation loss)
- Blowdown discharge: 10-20% of makeup water (maintains water quality, prevents mineral buildup)
- Annual total: ~20-75 million gallons
- 90%+ reduction vs. once-through
- But still substantial when multiplied across 17 projects
Closed-Loop + Waste Heat Recovery (BEST – Finland Model):
- Heat removed via heat exchangers to district heating (not evaporated to atmosphere)
- Minimal evaporation loss (no cooling towers running continuously)
- Makeup water: ~10,000-40,000 gallons/day (system leaks, minor evaporation only)
- Annual total: ~4-15 million gallons
- 95%+ reduction vs. once-through
- 75-80% reduction vs. standard closed-loop
Why Water Quality Management Matters
All Closed-Loop Systems Require:
Chemical Treatment:
- Corrosion inhibitors (prevent pipe degradation)
- Biocides (prevent algae/bacterial growth)
- pH adjusters (maintain system balance)
- Scale inhibitors (prevent mineral deposits)
Blowdown (Periodic Water Discharge):
- Evaporation concentrates minerals and chemicals in circulating water
- Must periodically discharge small volume, replace with fresh water
- Prevents scaling, corrosion, biological fouling
- Must be treated before discharge (remove chemicals, meet water quality standards)
Waste Heat Recovery Advantage:
- Less evaporation = less mineral concentration
- Reduced chemical treatment needed (water quality more stable)
- Less frequent blowdown required
- Lower chemical discharge to environment
The Cumulative Impact Question
Michigan’s 17 Active Data Center Proposals:
If All Built with Standard Closed-Loop (No Heat Recovery):
- 17 projects × 50 million gallons/year average = 850 million gallons annually
- Chemical blowdown from 17 facilities entering Great Lakes watershed
- Concentrated discharge points (thermal and chemical impacts)
If All Built with Waste Heat Recovery (Finland Model):
- 17 projects × 10 million gallons/year average = 170 million gallons annually
- 80% reduction in water consumption
- Minimal chemical use and discharge
- Heat captured (not released to environment)
The Difference: 680 million gallons annually
For Context:
- Great Lakes total volume: 6 quadrillion gallons
- But it’s not about VOLUME – it’s about CONTAMINATION and THERMAL POLLUTION
- 17 discharge points of chemically-treated water add up
- Waste heat recovery eliminates most of the problem
What Michigan Lacks: Cumulative Assessment
Current EGLE Process:
- Reviews each project individually
- Permits based on single-facility impact
- No assessment of 17 projects TOGETHER
- No requirement to minimize water use
- No mandate for waste heat recovery
What’s Needed:
- Regional cumulative impact assessment (all projects in aggregate)
- Water use minimization requirements (best available technology)
- Waste heat recovery mandate for facilities >100 MW
- Great Lakes protection standards with enforcement
- Public reporting (monthly water use, chemical discharge, temperature monitoring)
Finland/EU Standard:
- Cumulative regional analysis required
- Best available technology mandated
- Heat recovery assessed for all projects >100 kW
- Public utility coordination (infrastructure planning)
The Question for December 18:
“Saline’s facility will use 4-15 million gallons annually with waste heat recovery, or 20-75 million gallons without it. Which system are we approving? And why isn’t waste heat recovery REQUIRED when it saves 80% of the water?”
👷 The Worker Question: Finland vs. Saline Jobs
The Math That Doesn’t Add Up
Saline Project:
- Capacity: 1,400 MW
- Promised permanent jobs: “75-100” (developer claims)
- Actual permanent jobs: 50-75 (DTE filings)
- Construction jobs: “Thousands” (vague, temporary)
Jobs per megawatt: 0.05 (using 75 jobs / 1,400 MW)
Microsoft Espoo (Finland):
- Capacity: 150 MW
- Permanent jobs: 240
- Construction jobs: Not disclosed (European privacy standards)
- Timeline: Long-term (20+ year planning horizon)
Jobs per megawatt: 1.6 (240 jobs / 150 MW)
The Gap: 32x Difference
Why Finland Creates 32x More Jobs Per Megawatt:
1. Heat Recovery Operations:
- District heating network operators
- Heat exchange system technicians
- Customer service (residential heating contracts)
- Billing and administration
- Maintenance crews (piping, pumps, distribution)
2. Integration Complexity:
- Dual-purpose systems require more staff
- Coordination with municipal utilities
- Real-time heat demand management
- Quality control (temperature, pressure monitoring)
3. Community Accountability:
- Can’t offshore operations (heating is local service)
- Can’t automate heavily (physical infrastructure requires humans)
- Long-term employment (mutual dependence with community)
4. Scale of Service:
- 100,000 homes serviced = customer relations staff
- Infrastructure covering 40% of city = extensive operations
- Revenue from heat sales = funds employment
Saline Model (No Heat Recovery):
What Gets Automated:
- Cooling operations (AI-managed systems)
- Monitoring (remote operations centers)
- Routine maintenance (robotics increasingly used)
- Security (automated surveillance, limited guards)
What Remains Human:
- Emergency response (minimal staffing)
- Complex repairs (contracted specialists, not employees)
- Compliance reporting (small administrative team)
Why So Few Jobs:
- Single-purpose facility (cooling only, not heating)
- Designed for minimal labor (operational cost reduction)
- Remote management (off-site operations centers)
- No community integration (no local service delivery)
Infrastructure Jobs: The Hidden Benefit
Building District Heating Networks:
Holland’s System:
- 190 miles of piping
- 35 years of operation
- Ongoing expansion capacity
Statewide Network ($500M investment):
- Estimated: 2,000-5,000 construction jobs (2-3 year build)
- Skills: Pipefitting, excavation, concrete, electrical, controls
- Workforce: Transferable from automotive/manufacturing
- Training: Community college partnerships (skilled trades)
Permanent Operations:
- Network operators: 500+ positions statewide
- Maintenance crews: Regional hubs
- Customer service: Billing, contracts, outreach
- Engineering: System expansion, optimization
Skills Required:
- HVAC technician (familiar to Michigan workforce)
- Electrical controls (manufacturing workers transfer)
- Mechanical systems (automotive technicians transfer)
- Civil infrastructure (road construction experience)
Can’t Outsource:
- Physical infrastructure requires local presence
- Emergency response must be immediate
- Community integration requires local knowledge
- Union workforce (prevailing wage on public infrastructure)
The Manufacturing Connection
Michigan’s Displaced Workforce:
- Thousands of automotive jobs lost 2020-2025 (plant closures, supplier consolidation, EV transition)
- Skilled trades aging out (retirements, no replacement pipeline)
- Manufacturing facilities closing (automation, production shifts)
Transferable Skills:
- HVAC systems (data center cooling = automotive climate control systems)
- Electrical distribution (data center power = factory electrical)
- Mechanical maintenance (industrial equipment experience transfers)
- Controls/automation (manufacturing automation = building automation)
- Shift work culture (24/7 operations = familiar)
District Heating Networks Specifically Need:
- Pipefitters (install/maintain distribution systems)
- Electricians (pump controls, monitoring systems)
- HVAC technicians (heat exchange, temperature management)
- Mechanical engineers (system design, optimization)
- Controls specialists (automated management systems)
Community College Pipeline:
- Washtenaw CC, Oakland CC, Macomb CC, Wayne County CC
- HVAC programs, electrical apprenticeships, pipefitting trades
- 6-18 month programs (faster than 4-year degrees)
- Industry certifications (EPA, NATE, RETA)
- Job placement rates >80% (skilled trades demand)
The Honest Assessment
Data Center Jobs Alone:
- 500-750 permanent positions statewide (17 projects × 50 average)
- Mostly specialized technical roles (computer engineering, network infrastructure)
- Difficult entry for displaced manufacturing workers
- Remote management trend (operations centers consolidating)
- Automation increasing (fewer workers per MW over time)
Data Centers + District Heating Infrastructure:
- 2,000+ construction jobs (building networks, 2-3 years)
- 500-750 data center operations (specialized technical)
- 500+ network operations (local, can’t outsource)
- 1,000+ maintenance/service (distributed statewide)
- Total: 4,000+ positions (8x current approach)
Plus:
- Displaced manufacturing workers CAN transition (transferable skills)
- Community colleges CAN train (programs exist)
- Jobs CAN’T be outsourced (physical infrastructure is local)
- Employment IS stable (100-year infrastructure, not 25-year tax exemption)
🤝 Both Perspectives: Workers AND Communities Win
The False Choice
Current Debate Framing:
Pro-Development:
- “We need jobs” (employment argument)
- “Economic growth” (tax base expansion)
- “Oppose this and you’re anti-worker”
Anti-Development:
- “We need environmental protection” (Great Lakes, farmland)
- “Corporations don’t benefit us” (subsidy criticism)
- “Support this and you’re anti-community”
This framing makes it seem like workers and communities have opposing interests.
They don’t.
What Workers Actually Need
Not temporary construction jobs that end in 2 years.
Not 50 permanent positions requiring specialized degrees most displaced workers don’t have.
Not jobs that disappear when tax exemptions expire and data centers relocate.
What displaced manufacturing workers need:
1. Accessible Entry:
- Skills they already have transfer (HVAC, electrical, mechanical)
- Training programs under 18 months (not 4-year degrees)
- Certifications, not credentials (industry-recognized, employer-valued)
2. Stable Employment:
- 20+ year horizon (not boom-bust construction cycles)
- Can’t be outsourced (physical infrastructure requires local presence)
- Union-scale wages (prevailing wage on public projects)
3. Meaningful Work:
- Serving their community (heating neighbors’ homes, improving safety)
- Building infrastructure (visible, tangible contribution)
- Skills valued (expertise recognized and compensated)
Finland model delivers this. Proposed Saline model doesn’t.
What Communities Actually Need
Not job promises that evaporate after tax exemptions.
Not farmland destruction with zero public benefit.
Not environmental risk in exchange for corporate profit.
What communities fighting data centers actually want:
1. Local Benefit:
- Jobs that go to LOCAL residents (not traveling crews)
- Infrastructure that serves COMMUNITY (heating homes, clearing streets)
- Long-term investment (decades, not tax exemption window)
2. Environmental Protection:
- Great Lakes preservation (closed-loop cooling, zero discharge)
- Farmland protection (brownfield-first development)
- Groundwater safety (comprehensive remediation, monitoring)
3. Democratic Process:
- Transparent contracts (no “blacked out paragraphs”)
- Genuine public input (not rubber-stamp hearings)
- Accountability (performance standards, enforcement)
Finland model delivers this. Saline model doesn’t.
The Common Ground
Workers need:
- Accessible, stable jobs with transferable skills
Communities need:
- Local benefit, environmental protection, democratic process
Finland Model provides both:
- Infrastructure jobs (workers)
- Heat recovery (community benefit)
- Closed-loop systems (environmental protection)
- Long-term contracts (stability for both)
- Public utility coordination (democratic accountability)
Saline Model provides neither:
- Specialized jobs displaced workers can’t access
- Zero community benefit (no waste heat recovery)
- Environmental risk (contamination concerns, water impacts)
- 25-year tax exemption then evaluate relocation
- Fast-track approval bypassing public input
The Coalition Nobody’s Building
Who Should Be Allied:
Labor Unions:
- Construction trades (building networks = jobs)
- HVAC/electricians (operating infrastructure = careers)
- Manufacturing unions (displaced members need transition pathways)
Environmental Groups:
- Great Lakes protection organizations
- Farmland preservation advocates
- Climate action coalitions (fossil fuel displacement)
Community Organizations:
- Township associations fighting data centers
- Agricultural interests opposing farmland conversion
- Resident groups demanding accountability
Economic Justice:
- Worker centers serving displaced manufacturing
- Community development corporations in brownfield areas
- Housing advocates (lower utility costs = affordability)
These groups are currently fighting SEPARATELY.
Developers exploit division:
- Tell workers: “Environmentalists want to kill your jobs”
- Tell communities: “Workers need this, you’re being selfish”
- Tell both: “Take what we offer or get nothing”
The Unified Demand
“Build data centers the Finland way, or we’re not interested.”
What that means:
For Workers:
- Infrastructure jobs building networks (accessible entry, stable employment)
- Operations jobs maintaining systems (local, can’t outsource)
- Training pipelines through community colleges (funded by project)
For Communities:
- Waste heat recovery (residential heating, snowmelt, public benefit)
- Brownfield-first priority (remediation, no farmland destruction)
- Closed-loop cooling (Great Lakes protection)
- Transparent contracts (community benefit agreements, enforcement)
For Data Centers:
- Lower cooling costs (30-40% energy savings)
- Revenue from waste heat (business model alignment)
- Sustainability credentials (ESG goals, corporate commitments)
- Regulatory certainty (long-term planning, stable framework)
- Community support (easier permitting, faster approvals)
Everybody wins. Current model: Only corporations win.
📅 What Comes Next: December 18 & Beyond
The Immediate Timeline
December 18, 2025 – Saline Township Public Hearing:
Topic: Final rezoning decision for $7B data center
What’s At Stake:
- Precedent for 16 other Michigan proposals
- DTE’s “6 gigawatts of additional projects” future
- Whether communities have leverage or just theater
MPSC already approved infrastructure (Dec 5). Township can still reject rezoning, but faces same legal threat that forced settlement before.
The Questions That Matter
Don’t ask: “Can we stop this?”
Ask: “Can we demand Finland standards?”
1. Waste Heat Recovery:
“Holland, Michigan—less than 200 miles from here—has captured power plant waste heat for 35 years to melt 8 miles of streets. Why is there NO waste heat recovery plan for this 1,400 MW facility that could heat 46,000 homes?”
2. Public vs. Private Benefit:
“Holland’s snowmelt system cost $1.1M in 1988 and businesses pay 52¢/sq ft annually. Why are we subsidizing $500M to DTE instead of building public infrastructure that makes data centers WANT to locate here?”
3. Job Creation Standards:
“Finland’s data centers heat entire cities while EARNING revenue from waste heat. Microsoft Espoo: 150 MW = 240 jobs (1.6 per MW). This facility: 1,400 MW = 50-75 jobs (0.05 per MW). Why 32x fewer jobs than Finland standard?”
4. Brownfield-First Priority:
“Michigan has 450,000 brownfield sites. HB 4906 offers BETTER incentives for brownfield (through 2065) than greenfield (through 2050). Why approve farmland destruction before brownfield options exhausted?”
5. Economic ROI:
“Michigan spends $500M annually on winter road maintenance and $2.6B on weather-related accidents. Holland’s snowmelt eliminates both while lasting 100 years. Why subsidize 25-year data center tax exemption instead of infrastructure that saves $3B+ annually?”
6. Total Economic Impact:
“Every $1 invested in district heating infrastructure returns $25-33 in economic benefits (road savings + accident reduction + utility savings + productivity). Every $1 in data center subsidies returns… what exactly?”
What To Demand
Not “Stop the data center.”
Demand: “Build it with Finland standards or explain why not.”
Specific Requirements:
1. Waste Heat Recovery Plan:
- Technical assessment of heat capture feasibility
- Connection to Ann Arbor district heating (or commitment to build network)
- Revenue-sharing agreement (municipality benefits from heat sales)
- Performance standards (minimum % waste heat recovered)
2. Comprehensive Remediation:
- Pall site contamination fully assessed
- Groundwater treatment plan (20-year monitoring)
- Third-party verification (not developer self-assessment)
- Public reporting (quarterly water quality data)
3. Great Lakes Protection:
- Closed-loop cooling system (zero discharge)
- Water usage transparency (monthly public reporting)
- Contamination prevention plan (chemicals isolated from watershed)
4. Job Commitments:
- Actual permanent positions (not PR numbers)
- Local hiring preferences (Michigan residents first)
- Apprenticeship programs (community college partnerships)
- Wage standards (union scale for infrastructure work)
5. Public Transparency:
- Open contracts (no “blacked out paragraphs”)
- Community benefit agreement (negotiated before approval)
- Annual reporting (energy, water, employment, economic impact)
- Performance enforcement (penalties for non-compliance)
The Precedent Fight
Why Saline Matters Beyond Saline:
Michigan’s Active Pipeline:
- 17 proposals (various stages)
- DTE: “6 gigawatts of additional projects” planned
- Next 5 years: 10-15 approvals likely
If Saline Sets Precedent:
Bad Precedent (Current Path):
- Communities can’t demand waste heat recovery
- Ratepayers subsidize with no benefit requirement
- Fast-track approvals bypass public scrutiny
- Developers sue townships into submission
Good Precedent (If Amended):
- Waste heat recovery becomes standard
- Public benefit required for public subsidy
- Transparent process with genuine community input
- Brownfield-first priority established
Every Future Project Will Reference Saline Decision.
What happens December 18 matters for the next 20 years of Michigan data center development.
Beyond December 18: The Legislative Path
State-Level Policy Needed:
1. District Heating Infrastructure Investment
- $500M bond issue for statewide network
- Prioritize top 10 cities + data center corridors
- Match federal infrastructure funding
- Timeline: 2026-2028 build-out
2. Waste Heat Recovery Mandates
- Data centers >100 MW must assess heat recovery (EU model)
- Financial penalties for waste (incentivize capture)
- Revenue-sharing requirements (community benefit)
- PSC authority to enforce
3. Brownfield-First Enforcement
- Strengthen HB 4906 prioritization
- Require exhaustion of brownfield options before greenfield
- Comprehensive remediation standards
- Great Lakes protection requirements
4. Cumulative Impact Assessment
- Regional analysis (not project-by-project)
- Water withdrawal limits (total statewide)
- Energy grid capacity planning
- Community benefit accounting
5. Public Transparency Standards
- Open contracts (no confidential provisions for public subsidies)
- Community benefit agreements (binding, enforceable)
- Annual reporting (standardized metrics)
- Third-party auditing
Who Can Make This Happen
State Legislators:
- House Energy Committee
- Senate Economic Development Committee
- Environmental committees
- Appropriations (infrastructure funding)
State Agencies:
- Michigan PSC (waste heat authority)
- EGLE (environmental standards)
- MEDC (economic development incentives)
- Attorney General (enforcement)
Local Officials:
- Township boards (rezoning authority)
- County commissioners (regional coordination)
- City councils (district heating implementation)
- Planning commissions (development standards)
Advocacy Coalition:
- Labor unions + environmental groups + community organizations
- Unified demand: “Finland standards for Michigan data centers”
- Legislative lobbying + local organizing
- Media pressure + public education
🎯 How to Engage: What You Can Do
For Saline Residents
December 18 Hearing:
- Attend in person (Saline Township Hall, 7pm)
- Bring copies of this analysis
- Ask the 6 key questions (waste heat, jobs, brownfield, ROI)
- Demand Finland standards, not rejection
After December 18:
- Form coalition with labor + environmental groups
- Contact state legislators (demand waste heat mandates)
- Organize for next proposal (16 more coming)
- Build template for other communities
For Other Michigan Communities
With Active Proposals:
- Howell, Augusta, Grayling, Ypsilanti, etc.
- Use Saline questions at your hearings
- Demand Finland standards BEFORE approval
- Coalition-building (don’t fight alone)
Without Proposals Yet:
- Proactive organizing (it’s coming)
- Build district heating vision (before developers arrive)
- Contact legislators (policy changes now prevent problems later)
For Workers & Unions
Manufacturing Workers:
- Contact community colleges (HVAC, electrical, pipefitting programs)
- Research transferable skills (what you know translates)
- Organize for infrastructure jobs (demand training + placement)
Labor Unions:
- Construction trades: Demand prevailing wage on infrastructure
- HVAC/electrical locals: Position for operations jobs
- Manufacturing unions: Transition pathway for displaced members
- Coalition with environmental groups (aligned interests)
For State Legislators
We Can Present This Analysis:
- Committee hearings (data + policy framework)
- Stakeholder briefings (labor + environmental + community)
- Policy development (draft legislation)
Contact: angela@theopenrecord.org
This is the economic case for infrastructure investment disguised as a data center debate.
For Academic Researchers & Think Tanks
If you’re studying any piece of this puzzle:
- Energy engineering (waste heat recovery)
- Urban planning (district heating networks)
- Economics (infrastructure ROI)
- Policy analysis (subsidy effectiveness)
- Transportation (winter maintenance)
- Public health (accident economics)
We synthesized your research. Let’s collaborate.
What we need:
- Validation of $50B economic impact calculation
- Peer review of methodology
- Amplification through academic channels
- Translation to additional states
Contact: angela@theopenrecord.org
For Media
This Story Has Everything:
- David vs. Goliath (townships vs. corporations)
- Holland’s 35-year secret (local proof nobody talks about)
- Finland comparison (international success model)
- $50 billion in savings (economic blockbuster)
- Worker-community coalition (unusual alliance)
- December 18 hearing (immediate news hook)
Available:
- Comprehensive source documentation
- Interview with analyst (angela@theopenrecord.org)
- Graphics/charts (economic impact, job comparison)
- Expert commentary coordination
📚 Sources & Methodology
This analysis synthesizes:
- 20+ academic papers (energy engineering, economics, urban planning)
- European policy frameworks (EU, Germany, Finland)
- U.S. government research (NREL, ASME, Rice University)
- Michigan-specific data (Holland system, DTE costs, Saline project)
- BLS occupational data (job creation benchmarks)
- Transportation research (winter accident economics)
- Public health studies (injury cost analysis)
Comprehensive source list: provided on request
Methodology documentation: provided on request
Contact for data requests: angela@theopenrecord.org
💬 Final Thoughts
This isn’t about stopping progress.
This is about defining what progress actually means.
Does progress mean:
- Spending $3B to subsidize corporations?
- Destroying farmland to build facilities that create 50 jobs?
- Dumping waste heat into the atmosphere while residents pay $1,200/year for heating?
- Spending $500M annually on winter road maintenance we could eliminate?
Or does progress mean:
- Building infrastructure that saves $50B over 20 years?
- Creating 4,000+ accessible jobs for displaced manufacturing workers?
- Heating 100,000+ homes with waste heat that’s currently wasted?
- Making Michigan the North American leader in sustainable data center development?
Holland proved it 35 years ago. Finland scaled it. Michigan can lead.
December 18 is just the beginning.
A Note on Methodology
This analysis synthesizes:
- 20+ academic papers (energy engineering, economics, urban planning)
- European policy frameworks (EU, Germany, Finland mandates)
- U.S. government research (NREL, ASME, Rice University)
- Michigan-specific data (Holland system, DTE costs, Saline project)
- BLS occupational data (job creation benchmarks)
- Transportation research (winter accident economics)
- Public health studies (injury cost analysis)
Sources available at: pivotintel.org
Our role: We don’t do original research. We synthesize existing research that’s trapped in academic, governmental, and other silos and translate it into actionable policy frameworks that workers, communities, and legislators can actually use.
If you’re an academic researcher, think tank analyst, or university studying any piece of this puzzle: We want to talk. Contact: angela@theopenrecord,org
If you’re a Michigan legislator or staffer: We can present this analysis to committees. This is the economic case for infrastructure investment disguised as a data center debate.
If you’re a community fighting a data center proposal: You don’t have to say “no to data centers” – you can demand “Finland standards or we’re not interested.”
📌 ALSO THIS WEEK
Career Intelligence:
- Under the Radar – December 5, 2025 – Top 4 career opportunities (only 4 meet standards this week), Forward Deployed Engineer emerges as #1. Major shakeup due to push-button AI agent deployment.
- What the 1980s-90s IT Revolution Teaches Us – Historical parallels: displacement happens faster than workers realize
AI Deployment Analysis:
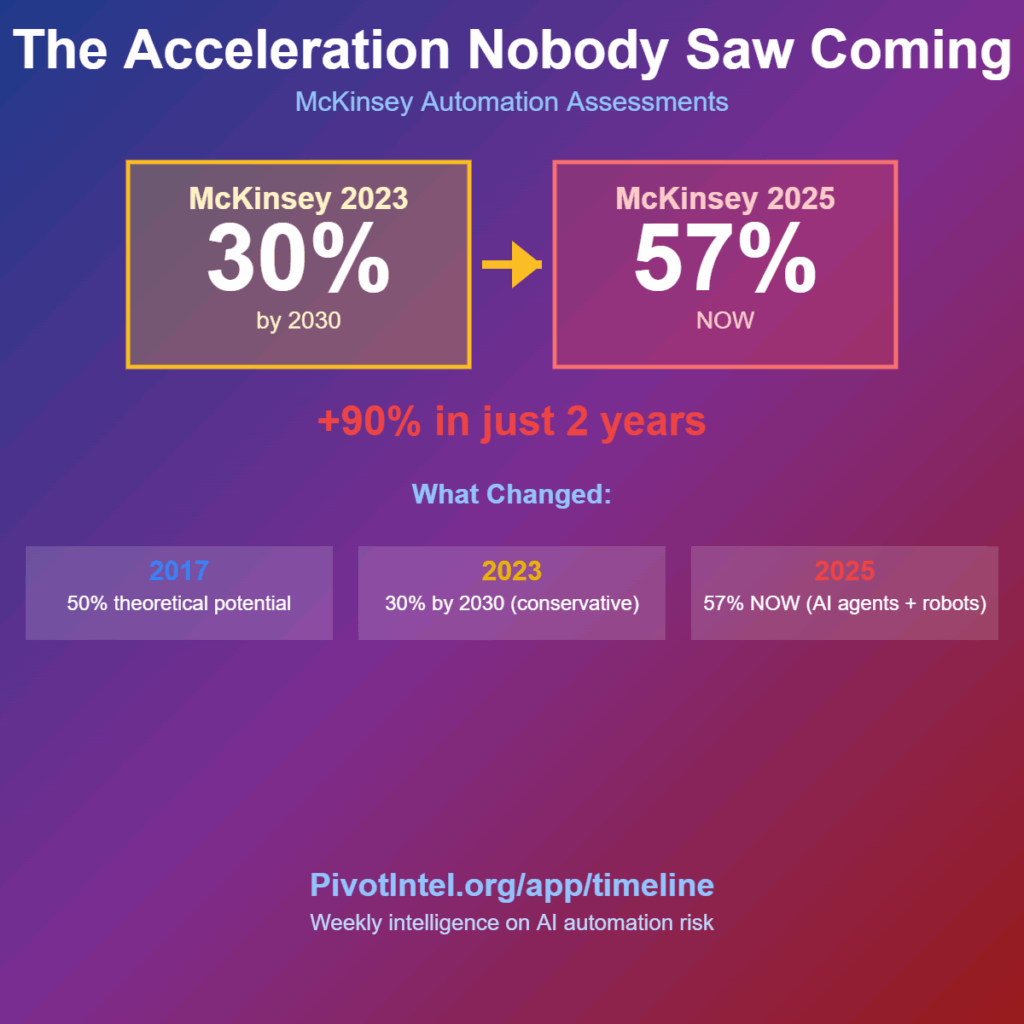
- BREAKING: McKinsey Said 57% of Jobs Face AI Impact – November 2025 findings on knowledge work displacement + Salesforce/AWS/Anthropic give 24,600 companies push-button AI agents (the barrier that just fell)
- Why AI Deployment Continues Despite Mass Layoffs – “AI Isn’t A Bubble” series, Article 2
Subscribe to get it first: theopenrecordl3c.substack.com
🔗 RESOURCES
Track Your Career Risk:
- Occupation Risk Tracker – 22 major job categories analyzed with AI automation scores
- Under the Radar Newsletter – Weekly career opportunities (published Fridays)
Infrastructure Intelligence:
- PivotIntel App – Michigan’s 9+ data center projects mapped (beta)
- Cost-Per-Job Calculator – Analyze subsidy deals
- FOIA Templates – Request transparency from your community
Latest Analysis:
- McKinsey November 2025 – 57% of jobs face AI impact, push-button agents now available
- Under the Radar – Dec 5 – Only 4 opportunities meet our standards (down from 5)
Next Edition: December 14, 2025
PivotIntel provides regional AI infrastructure intelligence for workers, communities, and professionals navigating the AI transformation.
Free subscription at theopenrecordl3c.substack.com